Our initial testing uses air quality monitor hardware that streams data to the cloud at 5 minute increments. All units measure and report at these increments allowing multiple devices results to be compared at single point in time.
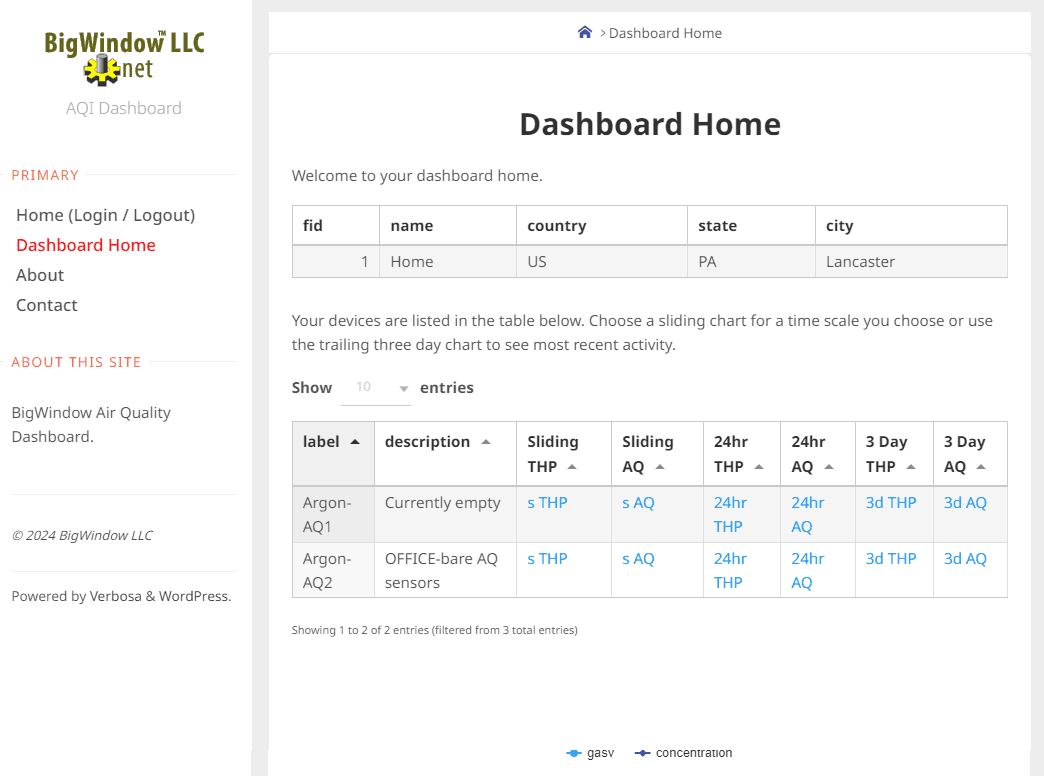
The draft web user interface (UI) allows three peeks into the data stream:
- Sliding temperature, humidity, and pressure (THP) or air quality (AQ). Here you can choose a start date and time and an end date and time for charting the stream at any of the devices at your location.
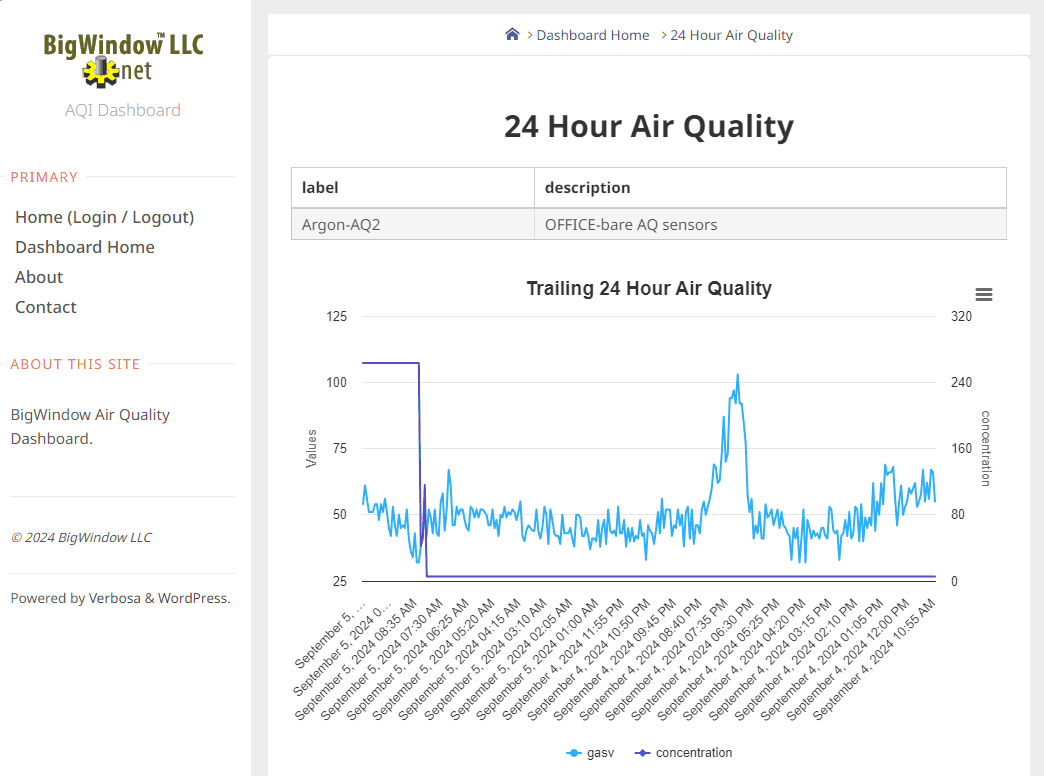
- Twenty four hour THP or AQ. Data from the trailing 24 hours of the stream.
- Three day THP or AQ. Data from the trailing 3 days of the stream.
Branding of the prototype UI starts as BigWindow LLC but will slide into the airqio.com domain after the draft versions.